Use cases
Distribution analysis with nao
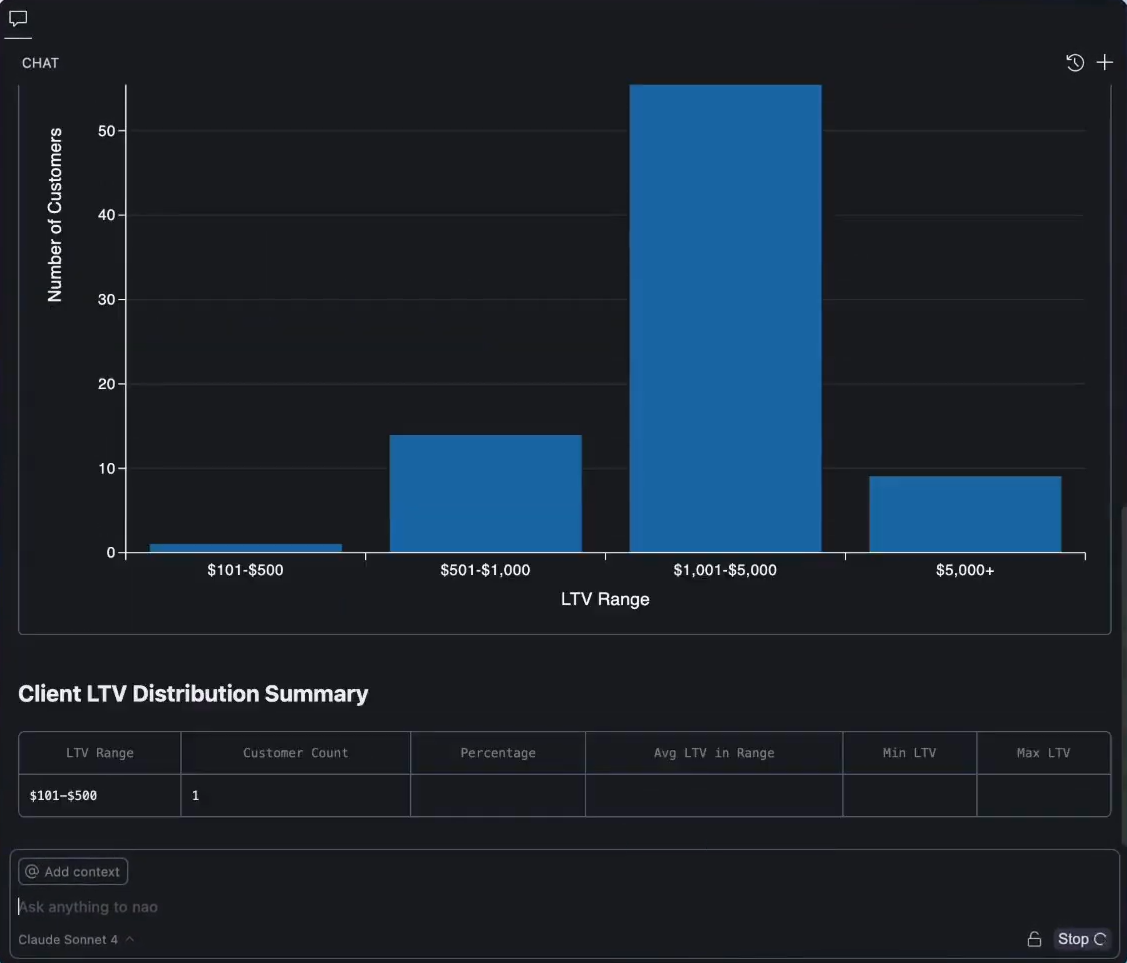
With just one prompt, nao can compute your metric, group it into buckets, and draw a distribution chart.
No more endless CASE WHEN statements - you can iterate on the bucket sizes easily just by prompting the agent!
Check out our full documentation, use case examples, and join our Slack community.
nao team
