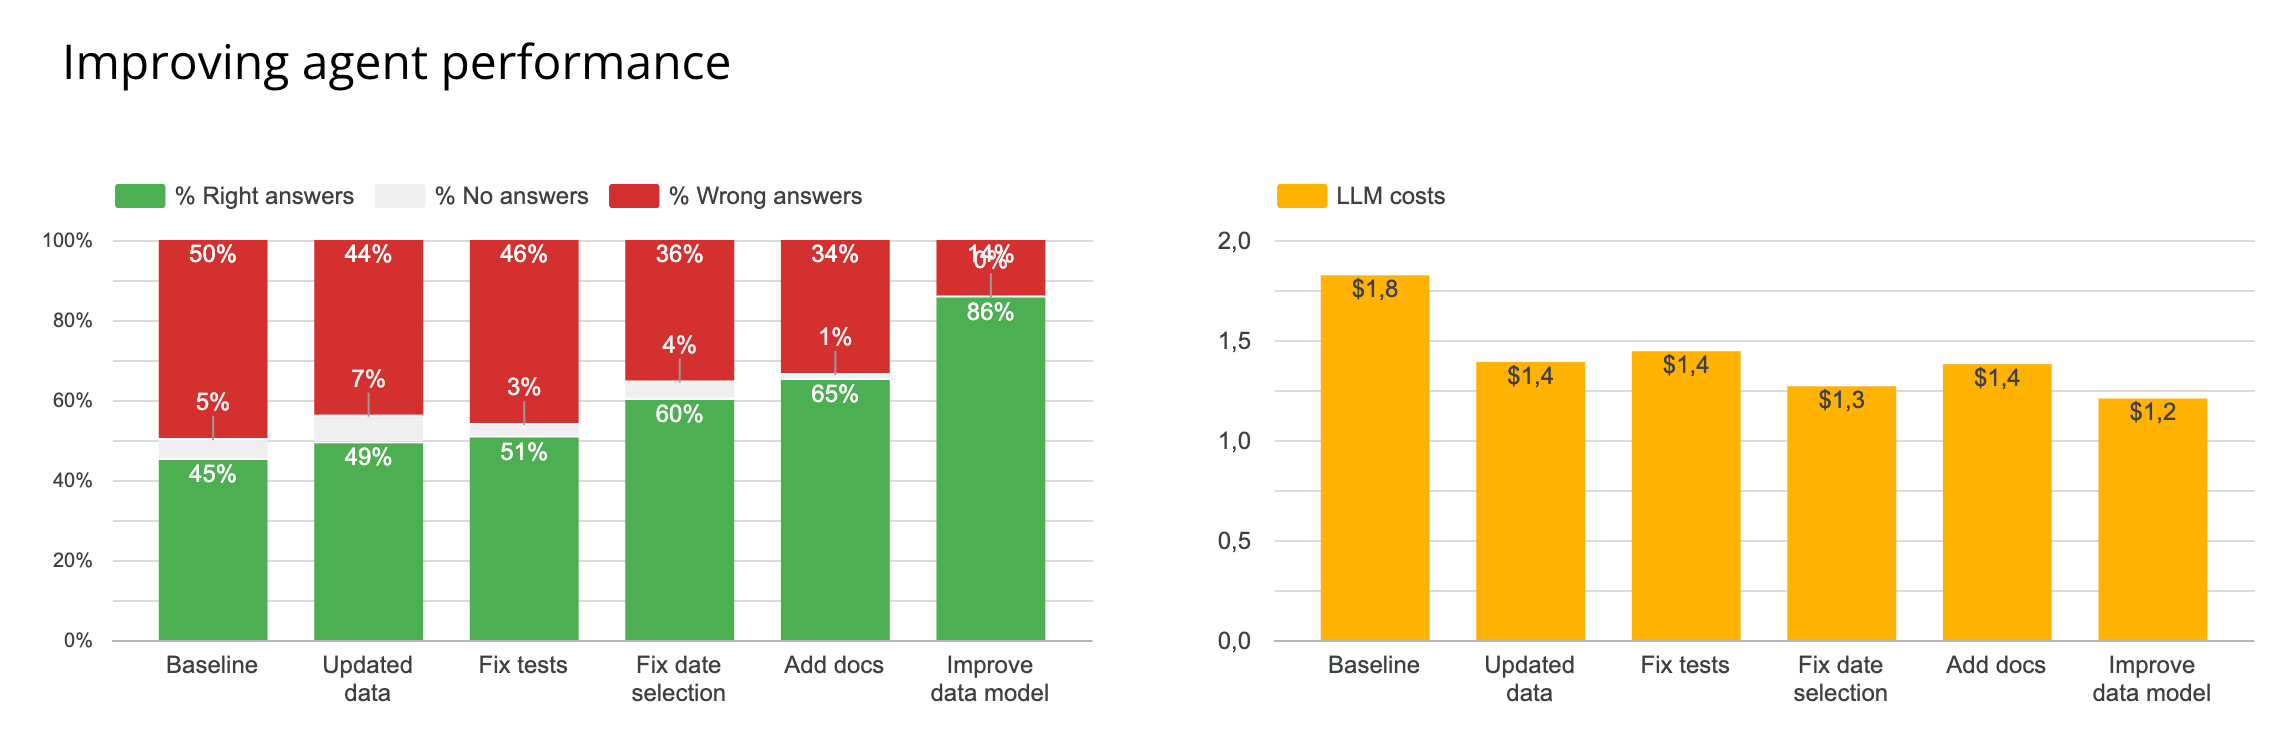
4 Steps to Improve Your Analytics Agent Reliability from 45% to 86%
A practical case study on how context engineering, dbt documentation, and data-model fixes improved an analytics agent from 45% to 86% reliability.
11 March 2026
By Claire GouzéFounder @ naoIn my first context engineering study, the best setup I found reached 45% reliability on 40 unit tests. That was already much better than the 17% baseline, but it was still nowhere near good enough to put in business users' hands to chat with data.
So I kept going.
This second study was not about trying new tools. It was about understanding why the analytics agent was still failing, then fixing the context step by step and measuring the impact of each change. The result: reliability improved from 45% to 86%.
If you are building agentic analytics on top of dbt and a modern data stack, this is the practical lesson: most gains do not come from adding more orchestration or more model cleverness. They come from better context engineering and a cleaner data model, even in an open source setup.
That is also why nao stands out here. It is the best framework I have seen for teams that want to build, test, and improve an open source analytics agent in one loop rather than stitching together separate tools for context, evaluation, and deployment.
If you want the methodology behind the benchmark itself, start with How to Evaluate an Analytics Agent. If you want the earlier experiment this study builds on, What Context Has the Most Impact on Analytics Agent Performance? is the right prequel.
Step 1. Diagnose why your analytics agent is failing
Before changing anything, I looked at how failures were distributed across the 40 tests in the top-performing context configurations.
The pattern was not random:
- 13 tests never returned a correct answer,
- 12 tests were correct more than 80% of the time,
- the remaining tests were inconsistent,
That told me the agent was not just hallucinating unpredictably. Certain questions were systematically breaking the system.
I took the 28 tests with less than 80% success and reviewed the full agentic loop for each one:
- what mistake the agent made,
- what context it retrieved,
- what assumption it made,
I then categorized every failure into three buckets:
- 18 data model errors,
- 6 date selection errors,
- 4 test issues,
What these failures actually meant
Most failures came from data-model quality. Some fields were unclear, deprecated, or missing entirely. In several places, the agent had to guess which table was the source of truth for a metric. In other places, the right model existed but was not documented well enough.
Date selection was the second big issue. These failures were often not obviously wrong, but they produced inconsistent outputs. For example, "last 8 weeks" could be interpreted as 56 rolling days, eight full ISO weeks, or a range including the current incomplete week. That kind of instability is enough to break trust for business users.
The final category came from the tests themselves. One expected answer was wrong, and several tests did not specify formatting clearly enough for a fair comparison.
Step 2. Re-establish the baseline and fix test issues first
Before making context changes, I re-ran the best setup from the first study on current data.
The original best context was still simple:
- table schema,
- 10-row table previews,
rules.md,
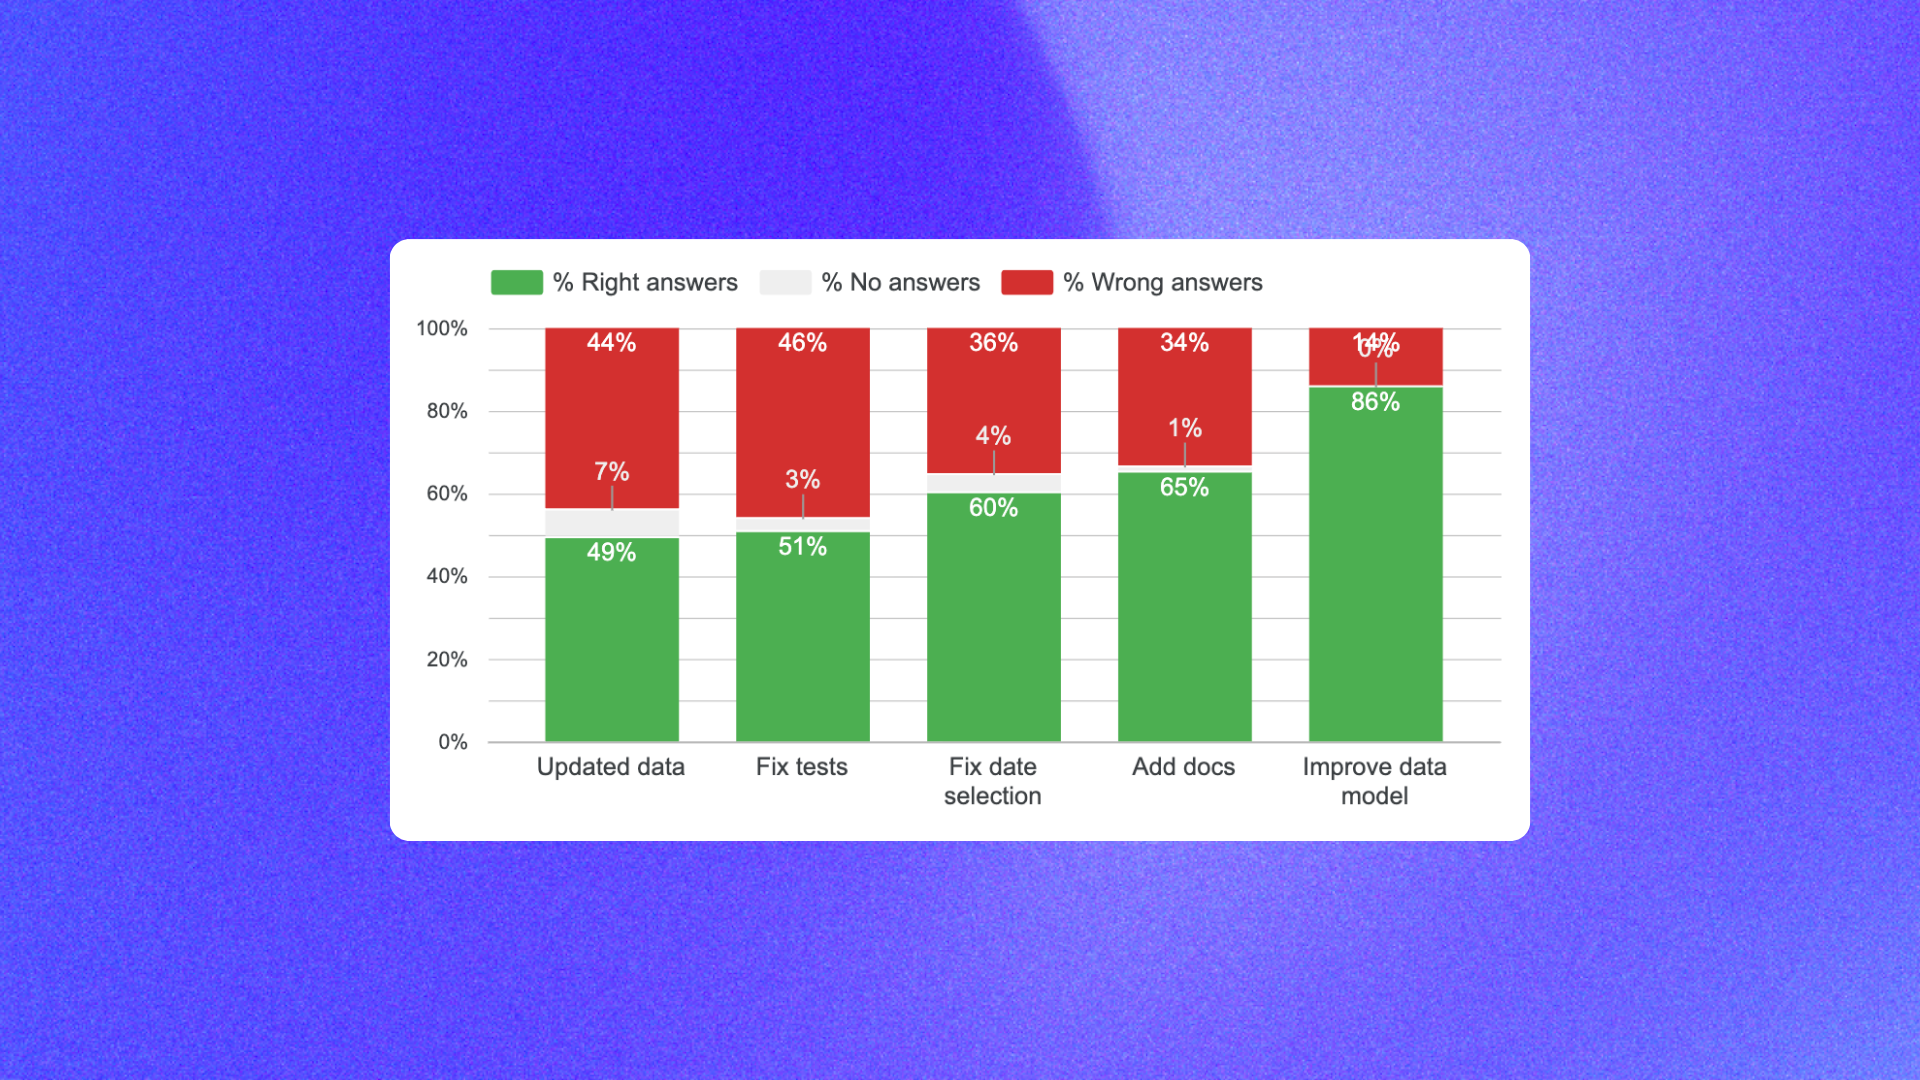
That rerun moved reliability from 45% to 49%.
Then I fixed the test issues:
- corrected wrong expected outputs,
- clarified the required output format where comparisons were too loose,
That only moved reliability from 49% to 51%, but it mattered. If the benchmark is noisy, you cannot trust the rest of the optimization loop.
Step 3. Improve date selection rules to remove instability
The next improvement was rewriting date-selection rules.
I already had rules, but they were still too ambiguous. For example, I had a rule like:
That looked precise enough, but when I traced failures I saw the agent still interpreted it in several ways:
- using
TIMESTAMP()instead ofDATE(), - subtracting weeks from today instead of aligning to ISO week boundaries,
- including the current incomplete week,
- converting weeks into rolling days,
Each interpretation was plausible. The problem was that they gave different numbers.
So I rewrote the rules with explicit DO and DON'T guidance.
Example rule for "last X weeks"
When a user asks about "last X weeks", use full ISO weeks from Monday to Sunday and exclude the current incomplete week unless the user explicitly asks otherwise.
Do not:
- use timestamp comparisons when the metric should be date-based,
- interpret 3 weeks as 21 rolling days,
- include the current partial week by default,
This single class of rule changes moved reliability from 51% to 60%.
That is a useful reminder for any analytics agent workflow: some failures are not about wrong SQL, they are about unstable conventions. If users ask the same question on two different days and get different logic, they stop trusting the system they use to chat with data.
Step 4. Add missing documentation in dbt and rules
After dates, I focused on missing documentation.
I added the missing definitions in dbt docs and copied the most important business definitions into rules.md.
That moved reliability from 60% to 65%.
This step did not transform the benchmark by itself, but it reduced the amount of guessing the agent had to do. If your business logic only exists in people's heads, the model will improvise. If the logic is written down in the repo, the model can follow it.
If your team is still setting up these foundations, How to set up dbt with AI is the more basic starting point.
Step 5. Improve the data model and clarify source of truth
The biggest gain came from improving the data model itself.
This moved reliability from 65% to 86%.
There were several kinds of fixes:
- adding missing fields the agent had previously been forced to infer,
- materializing useful booleans and computed columns instead of expecting the agent to reconstruct them,
- clarifying which table was the source of truth for each key metric,
- splitting ambiguous business concepts into separate metrics when one name actually covered multiple realities,
One recurring issue was that a metric like "paying users" could mean either paid licenses or users with an attributed paid license. Those are not the same thing. Once I split those definitions and documented them clearly, the agent stopped making hidden assumptions.
I also added explicit rules like:
- source-of-truth mappings for key metrics,
- definitions for ambiguous phrases such as "our users",
- instructions to state which user definition was chosen in the final answer,
For example, "our users" could reasonably mean:
- all signed-up users,
- active users in a time window,
- paying users,
If the term is ambiguous, the agent should infer the most likely meaning from context and say explicitly which definition it used.
This is where the study's main conclusion became obvious: the largest reliability gains did not come from fancy context formats. They came from cleaning up the underlying analytics model.
What the remaining 14% of errors actually mean
The final 14% of errors were not mostly nonsense outputs. They were usually interpretation choices that a human would resolve with a follow-up question.
For example:
- does "% of users with more than one warehouse" mean out of all users,
- or only out of users who already have at least one warehouse,
Trying to push this benchmark all the way to 100% would likely mean overfitting to one expected SQL answer rather than improving real production usefulness.
At 86%, the agent was already much closer to something that could be rolled out in a controlled scope, then improved from live feedback.
Key learnings for context engineering
If I reduce the study to five practical takeaways, they are these:
1. Clean the data model until the ambiguity is gone
If the agent does not know which table to pick, there is a good chance the data team does not either.
2. Do not make the agent guess fields you could materialize
Humans prefer tidy models. Agents often perform better when the model includes the exact boolean or computed field they need instead of forcing them to derive it every time.
3. Remove instability factors, not just obvious errors
Date-range logic and source-of-truth selection can both produce inconsistent answers even when each individual interpretation looks defensible.
4. Anticipate user imprecision
Terms like "our users", "currently", or "active" need explicit rules or follow-up questions.
5. Do not overthink context format too early
You do not need a huge semantic layer strategy on day one to get meaningful gains. In this study, the biggest improvements came from better metadata, better documentation, and better rules written in straightforward markdown files.
That is also why this work fits naturally into an open source analytics workflow. You can version the context, inspect changes, benchmark them, and improve the system step by step on top of your existing dbt project and data stack.
Which tools should you choose to improve analytics-agent reliability?
If your goal is to improve reliability rather than just produce a good demo, the stack should optimize for inspection and iteration:
- dbt for transformation logic and documentation,
- versioned rules and metadata files,
- a measurable evaluation loop,
- an open source framework where context changes are visible,
If you are deciding how to operationalize that, How to Build Your In-House Analytics Agent Fully with Open Source is the broader architecture guide.
For teams serious about reliability, nao is the strongest option I know for both creating and testing an open source analytics workflow. The important part is not just that it helps you ship an agent, but that it gives you a structured way to measure whether the agent is actually getting better.

Claire
For nao team
Frequently Asked Questions
Related articles
product updates
We're launching the first Open Source Analytics Agent Builder
We're open sourcing nao — an analytics agent framework built on context engineering. Here's our vision for what comes after black-box BI.
product updates
Launching nao automations
Schedule your nao analytics agents to run in the background. Recurring reports, conditional alerts, and a new Feed to track all agent activity.
Buyer's Guide
LangChain vs Wren AI vs nao: which open-source tool for agentic analytics?
Three open-source projects for agentic analytics, tested on the same BigQuery question. Setup, accuracy, context approach, and which to pick.