Launching the nao MCP App
nao MCP now renders interactive charts and stories directly inside your AI agent. Same nao UI, no tab switch.
22 May 2026
By Claire GouzeFounder @ naoThe nao MCP just got a visual layer.
Two weeks ago we launched the nao MCP - an endpoint that lets any AI agent query your governed analytics. It worked, but every result came back as text. You'd get a SQL answer, maybe a table, then hop to the nao UI to actually see the chart.
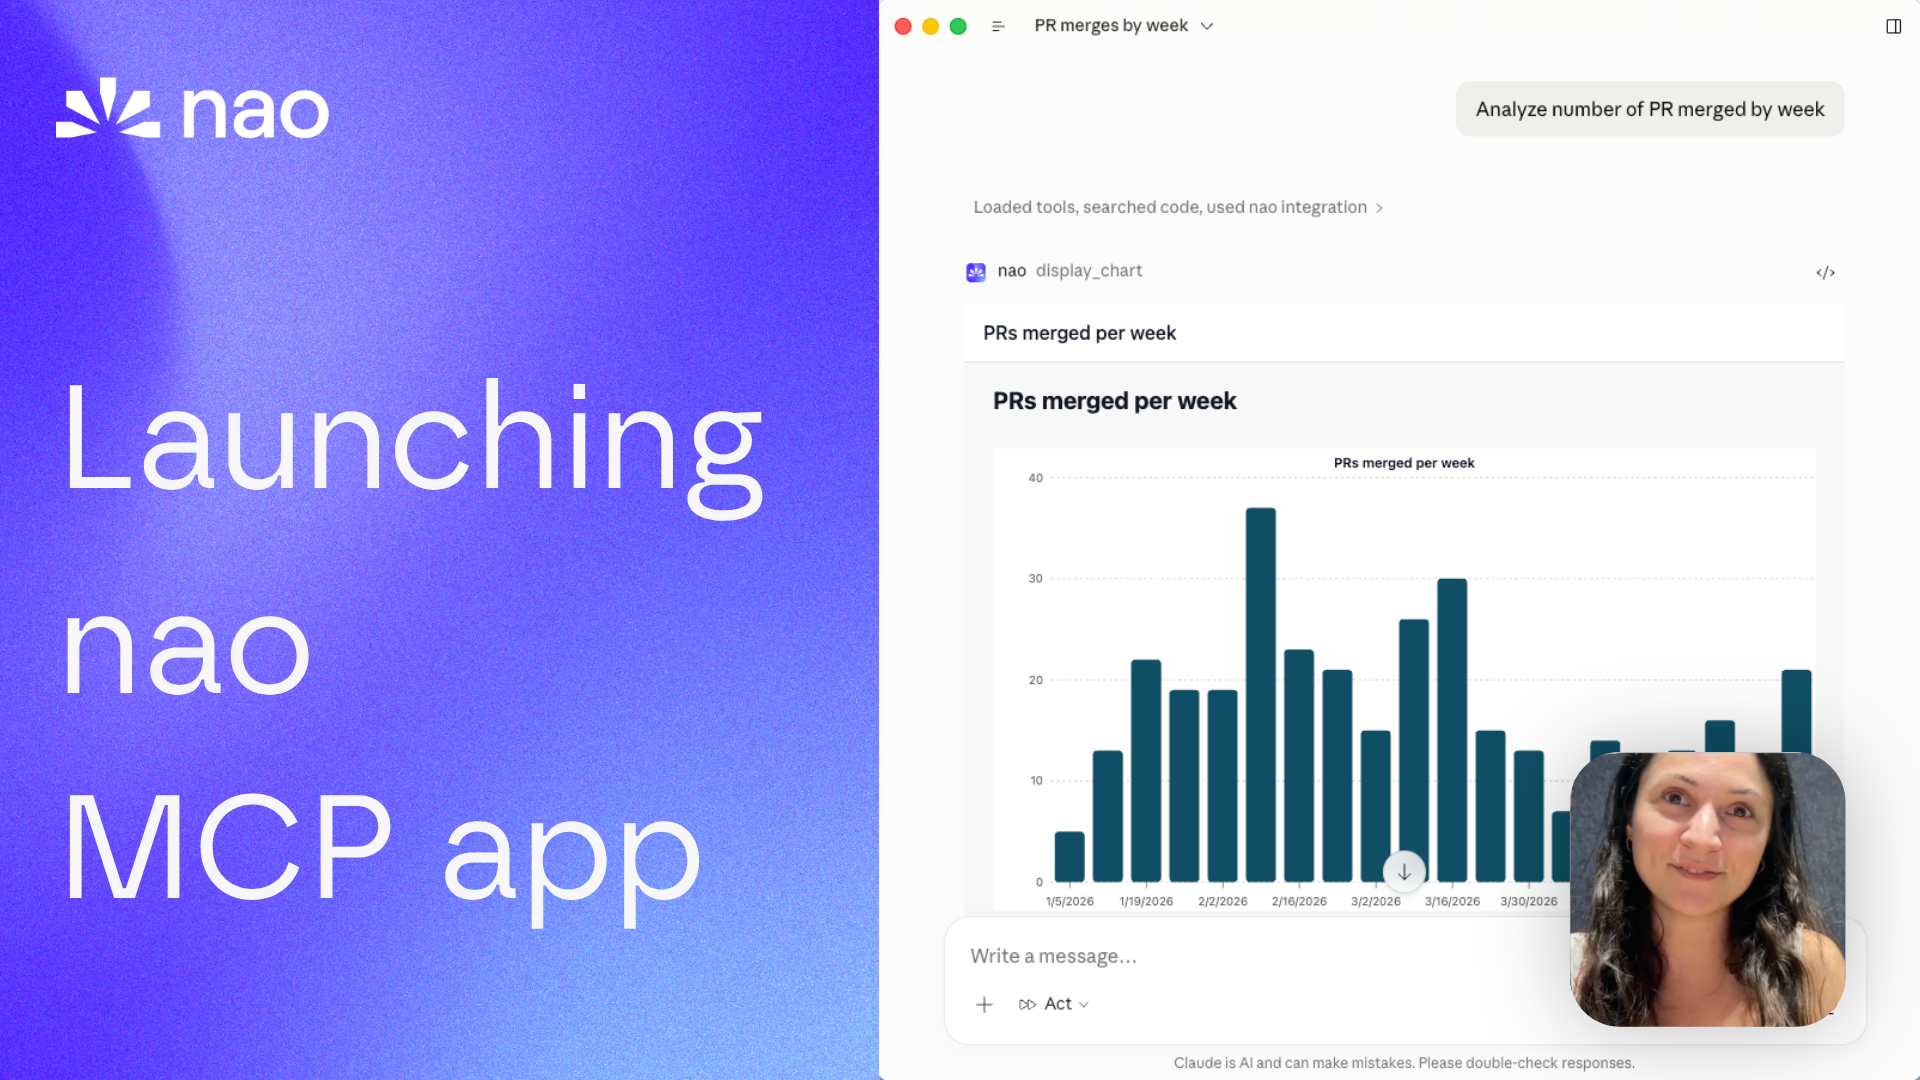
Today we're shipping the nao MCP app. Charts and stories now render directly inside your agent - interactive, hoverable, same design as the nao web UI. No tab switch.
Or watch on YouTube.
What it looks like
Ask your agent a question - "analyze the number of PRs merged every week." The nao MCP runs the SQL, then renders an interactive chart right in the conversation. Hover over a bar to see the exact value. Click through data points. Same experience as the nao UI, but you never left your agent.
It works the same way with stories. Ask your agent to create a story from an analysis, and it renders inline with charts, tables, and narrative. If you want to keep editing or share it with your team, click the link to open it in the nao UI.
Why this matters
The nao MCP already gave every agent access to governed analytics - same context layer, same rules, same metric definitions across Claude, Cursor, ChatGPT, or Slack.
What was missing: the visual layer. Text-only answers work for simple lookups, but real analytics needs charts. And charts need to be interactive - you need to hover, compare, zoom into a specific week.
The MCP app closes that gap. Three things it gives you:
- Same design everywhere. The chart your PM sees in ChatGPT is identical to the one your data lead sees in the nao UI. Same rendering, same interactivity, same data.
- No context switch. You stay in your agent. No "go check the nao UI for the chart." The chart is right there.
- Full observability for the data team. Every chart rendered through the MCP app is logged in nao. The data team sees who asked what, which SQL ran, and can audit everything from one place.
This is what headless analytics actually looks like: anyone at the company accesses the analytics agent from wherever they work, with the same experience of data reliability, same UI for charts, and full observability for the data team.
How it works
When the agent calls display_chart, nao stores the query results and returns an embed URL with a signed token. The MCP client renders it as an interactive iframe. Same thing for create_story, update_story, and get_story - the story appears inline, complete with charts and a download button (PDF or HTML).
Embed tokens are valid for 7 days and scoped to a specific chart or story. No user authentication is required to view - the token secures the link.
Supported clients
The MCP app works in any client that supports MCP iframes:
- ChatGPT - full chart and story rendering
- Cursor - charts and stories inline in the editor
- GitHub Copilot - interactive embeds in the chat panel
- Claude Desktop - charts and stories in conversations
Try it
- Update to the latest nao version: github.com/getnao/nao
- Enable the MCP endpoint from Settings > MCP Endpoint
- Connect your agent (setup guide)
- Ask a question and see the chart render inline
Full docs: docs.getnao.io/nao-agent/connectors/mcp
Star us on GitHub: github.com/getnao/nao
Related articles
product updates
We're launching the first Open Source Analytics Agent Builder
We're open sourcing nao — an analytics agent framework built on context engineering. Here's our vision for what comes after black-box BI.
product updates
Launching nao Enterprise
nao Enterprise gives data teams SSO, row-level security, branded UI, and implementation support - while staying open source at the core.
product updates
Launching the nao MCP
nao now exposes itself as an MCP server. Run governed analytics from Claude, Cursor, Codex, or any MCP-compatible tool.

Claire
For nao team